SolidWorks tracked the test
The reported first-mode error was 1.1% versus sine sweep and 1.9% versus random noise. Its second-mode result was also within 1.9% of the measured value.
Vibration testing · ME 3317 · Lab 7
I tested a scaled wing model on a shake table to find its bending frequencies, then checked the measurements against a Rayleigh estimate and a SolidWorks modal study.
My work included the test setup, sine-sweep and random-noise runs, SolidWorks model, Rayleigh calculations, and data analysis.
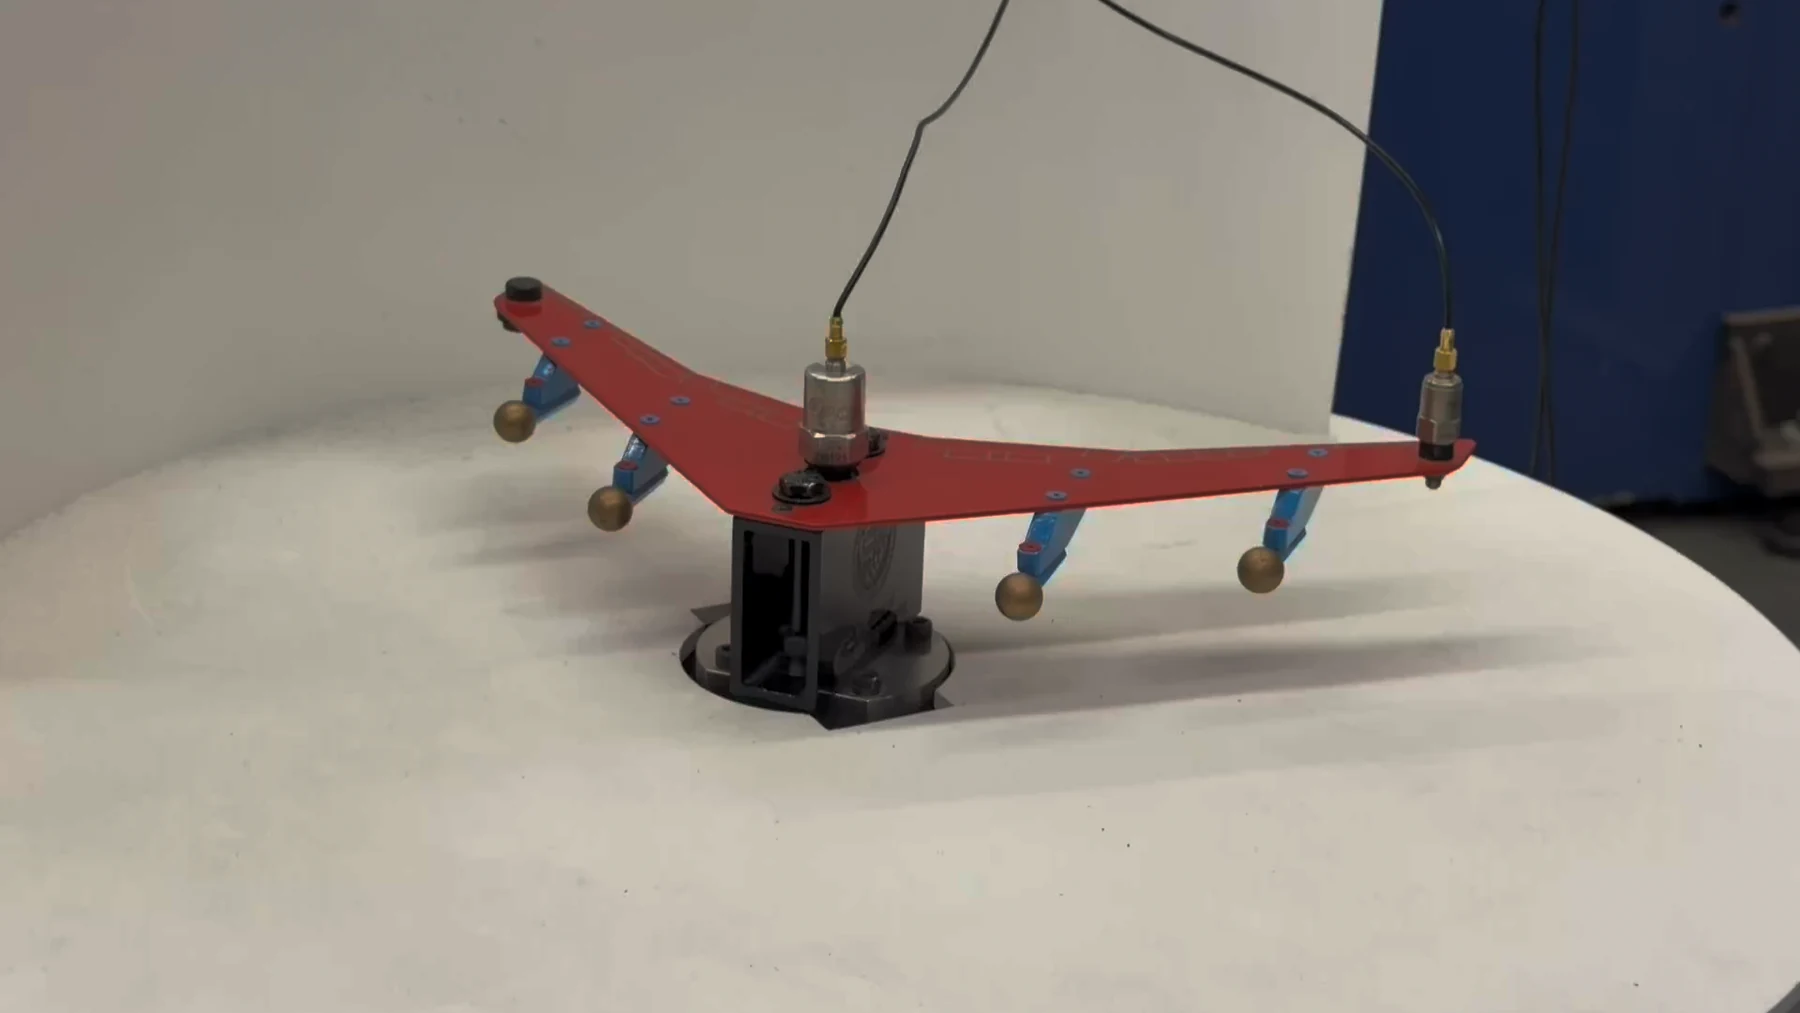
Test question
The tapered wing and attached engine masses change how it bends. I wanted to identify its first two bending frequencies, compare two test methods, and see how closely analytical and CAD predictions matched the hardware.
What I did
Applied Rayleigh's energy method to the distributed wing and attached masses.
Built a SolidWorks model and compared its bending modes with the physical response.
Used accelerometers at the base and tip to measure the wing's frequency response.
Used averaged FFT response data to check whether the same natural frequencies appeared.
Experimental evidence
The analyzer's frequency-response peaks identify resonance. The sine-sweep and random-noise results agreed within 0.25 Hz for the first bending mode.
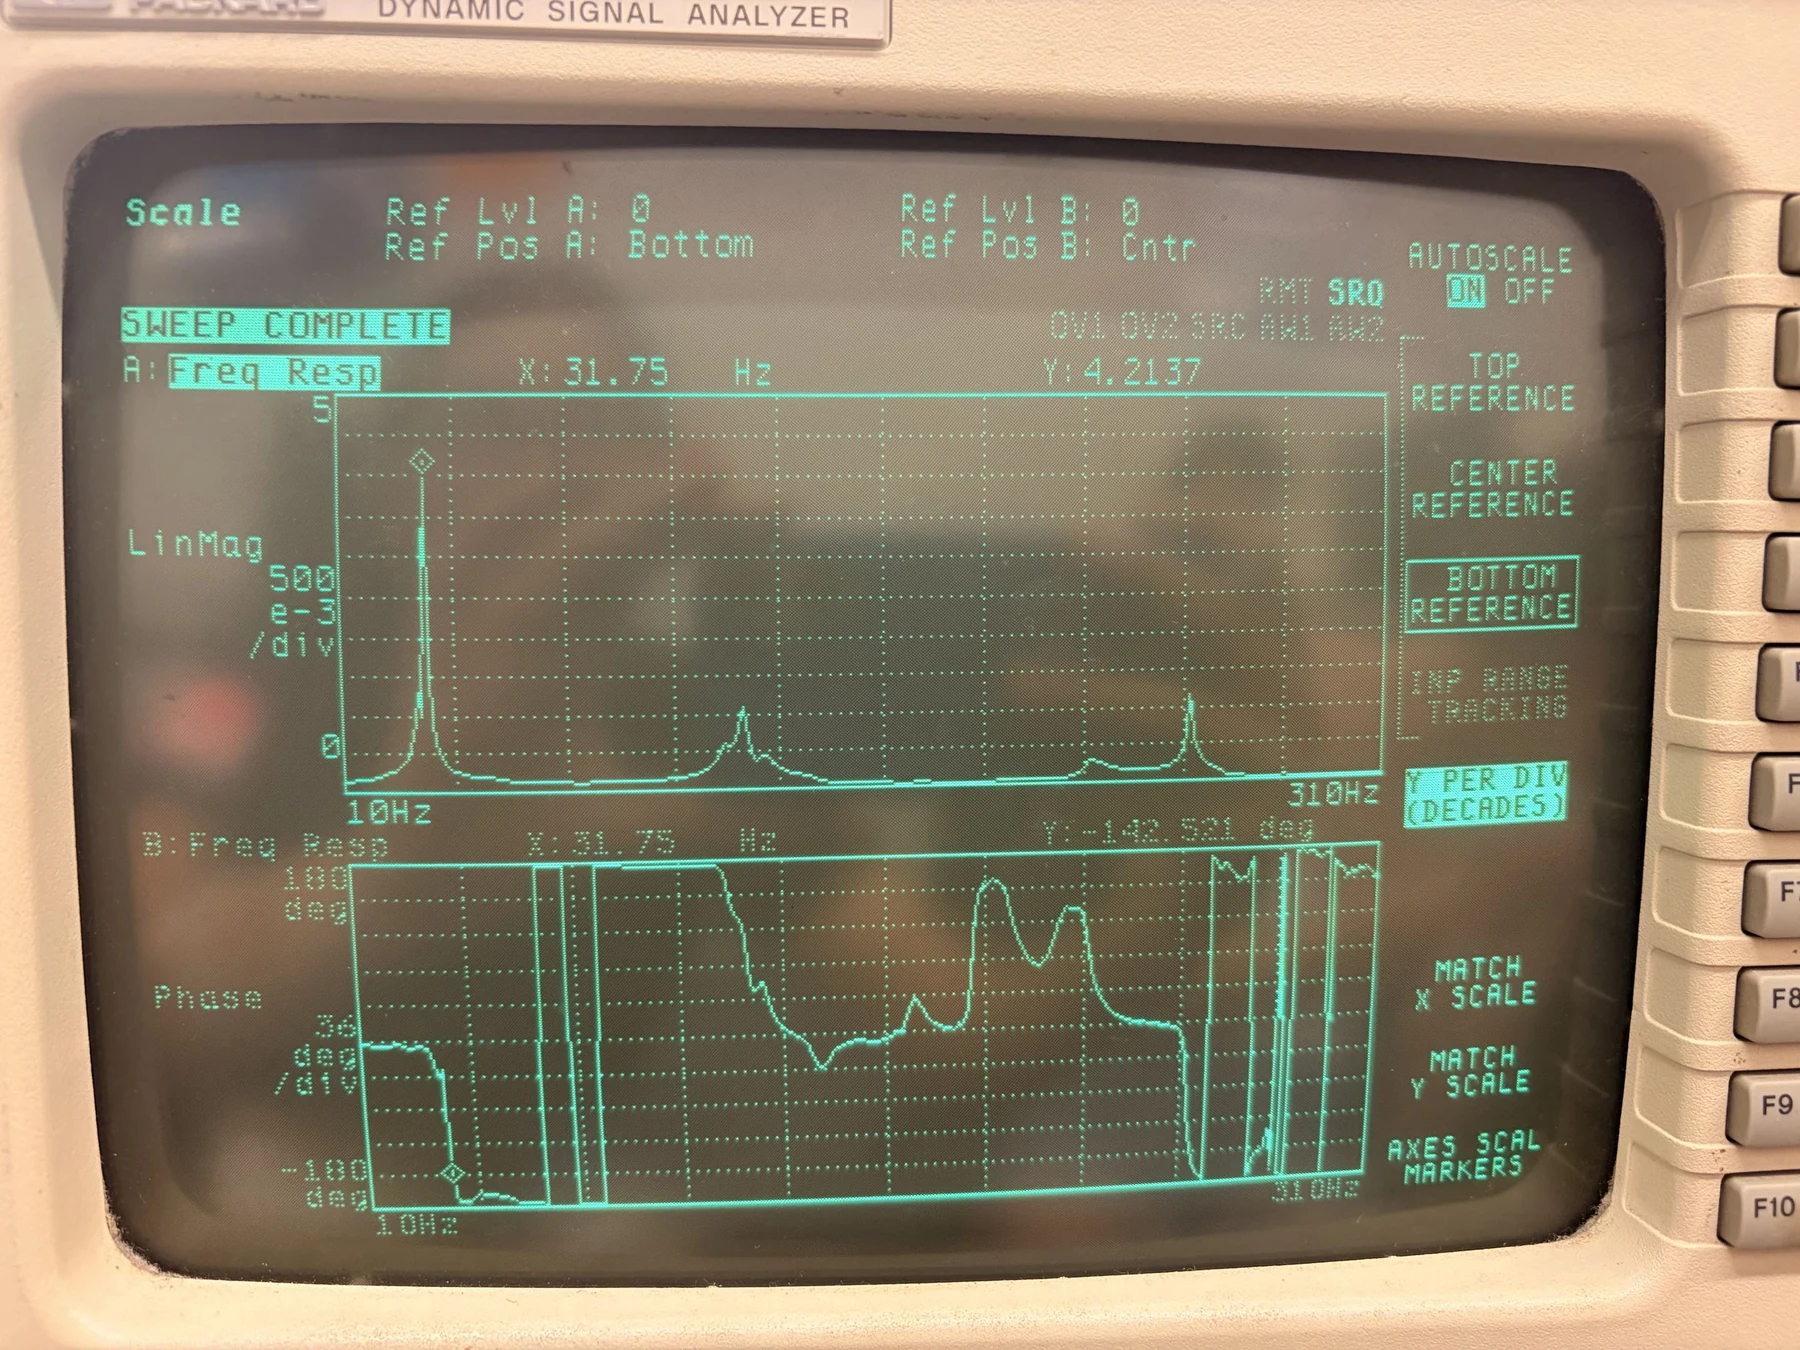
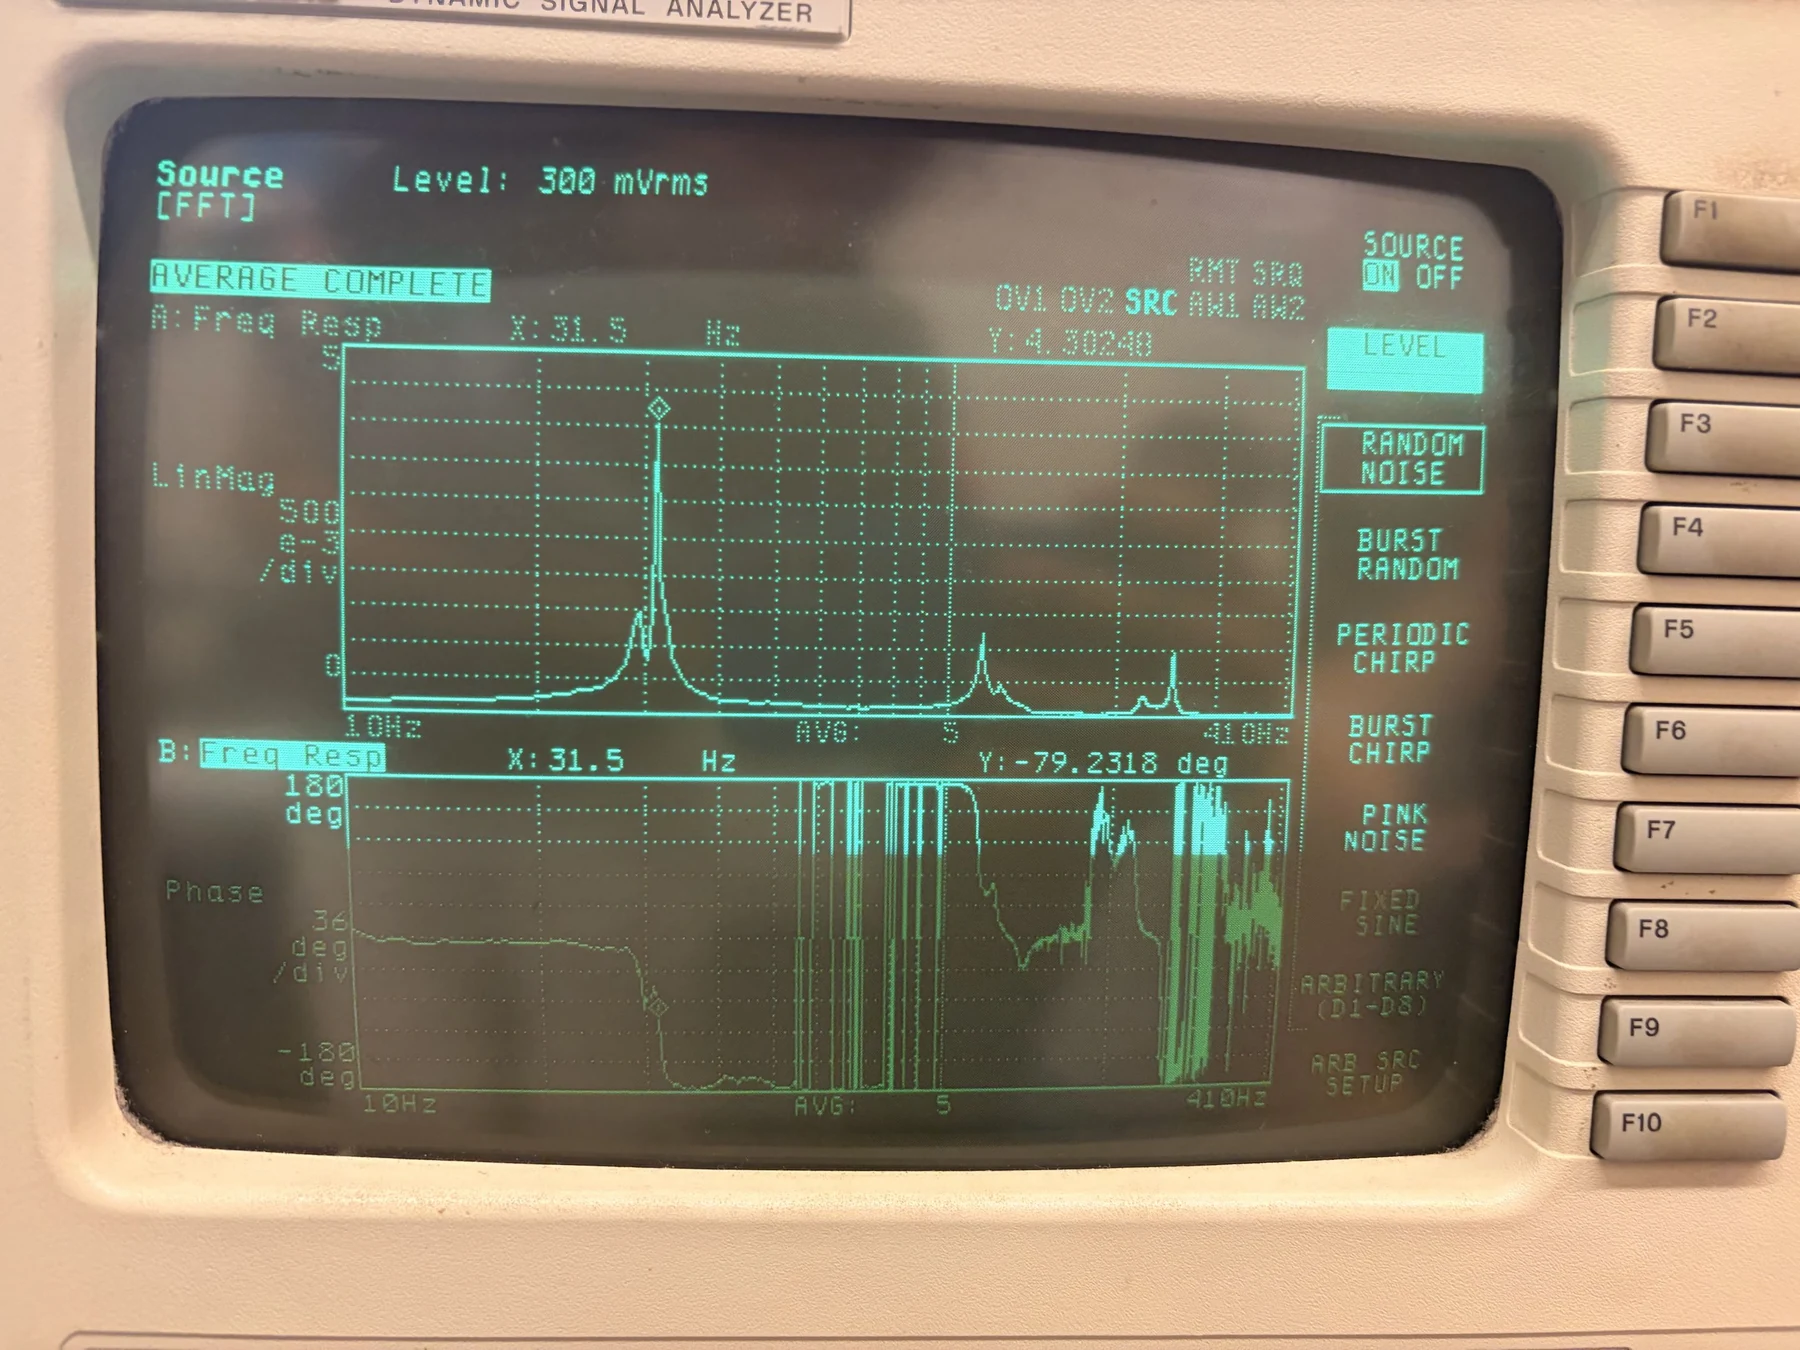
| Bending mode | Sine sweep | Random noise | Rayleigh | SolidWorks |
|---|---|---|---|---|
| First | 31.75 Hz | 31.5 Hz | 36.2 Hz | 32.1 Hz |
| Second | 251.5 Hz | 251.5 Hz | — | 246.9 Hz |
The reported first-mode error was 1.1% versus sine sweep and 1.9% versus random noise. Its second-mode result was also within 1.9% of the measured value.
The 36.2 Hz estimate exceeded the first-mode measurements by about 14–15%. The assumed deflection shape and simplified support conditions may explain part of the difference.
Model versus hardware
The first SolidWorks mode showed the wing bending about its central support, consistent with the visible up-and-down response during resonance testing. The CAD model predicted about 32.1 Hz for that mode.
Limit of the comparison: this was a scaled lab model. Clamp flexibility, mesh choices, and measured dimensions could shift the frequency, so agreement with one setup does not cover every mounting condition.
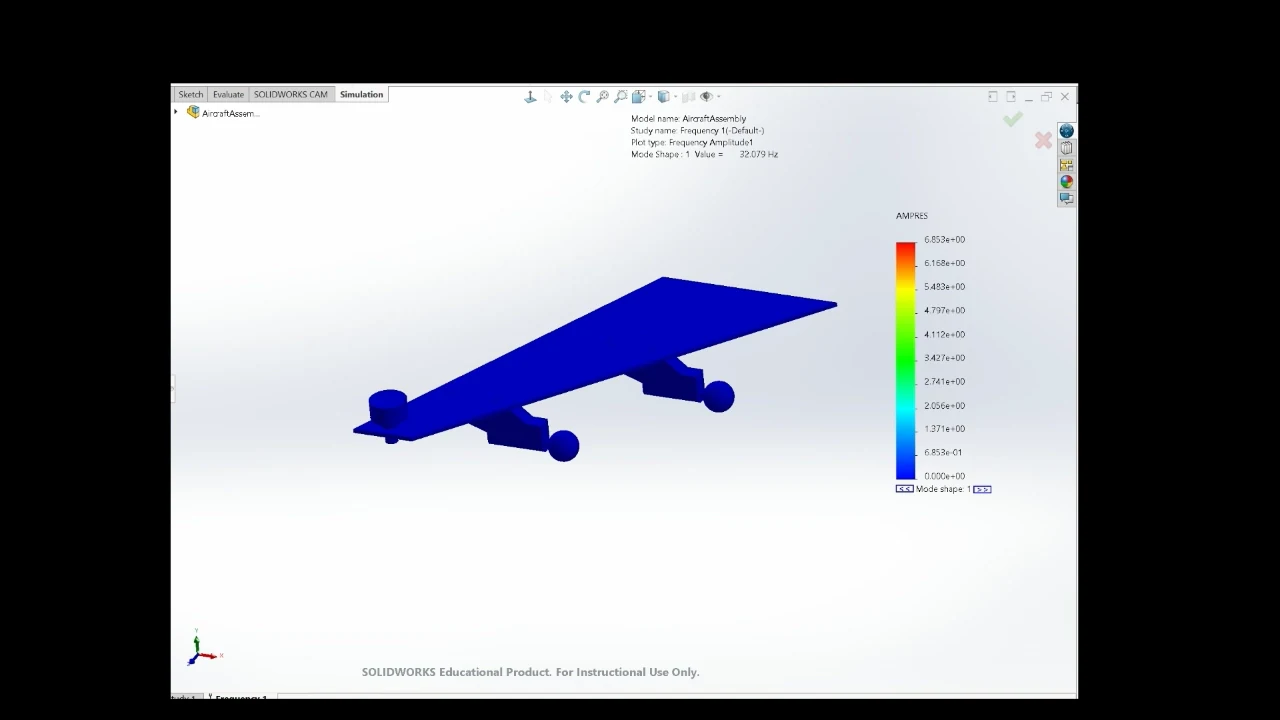
Two-person lab with Angelique Thioux. Photos, analyzer screens, and CAD image are from our ME 3317 Lab 7 presentation.